The study looked at whether STEMscopes Math plus coaching increased student math achievement in Texas. There were a few big questions:

We compared 2025 STAAR performance to 2024 STAAR performance by each grade for students in Pleasanton ISD in southcentral Texas. The district provided student-STAAR math scale scores and benchmarks for the 2024 and 2025 test. They used STEMscopes Math both years, but in 2024-2025, teachers also received 4-5 coaching sessions from Accelerate Learning (ALI). To make the comparison fair, we made sure that the 2024-2025 grade level classes were like the 2023-2024 classes on the number of students who were: boys/girls, ethnic/racial minorities, economically disadvantaged or included in special education. The only grade where the comparison wasn’t fair was 3rd grade. We used a method called propensity score matching to make comparisons fair.
Coaching significantly increased 2025 STAAR math performance for elementary students (3rd – 5th, see Table 1), but not for middle school students when compared to 2024.
Table 1: Effect of coaching on Pleasanton Elementary scores in 2025 versus 2024
|
Grade |
Estimated point change with coaching (plus standard error) |
Is this significant (p<0.05)? |
How big of an effect did coaching have? (0-.05 small, .06-.20 medium, >.20 big) |
What are the odds a studentachieved meets or masters? *means significant |
|
3rd grade |
21.94 (14.80) |
No, p = 0.17 |
0.07 |
1.83* 2.27* |
|
4th grade |
41.50 (14.88) |
Yes, p < 0.01 |
0.13 |
1.59* 1.89* |
|
5th grade |
58.26 (21.73) |
Yes, p < 0.01 |
0.13 |
2.09* 2.08* |
Our second question looked at 3rd- 8th-grade students’ progress in math learning across the 2024-2025 school year. For the first time, Pleasanton ISD used the NWEA MAP Math tests to track student progress. The MAP is a computer-adaptive test of math learning and was given to students in fall, winter, and spring. We linked MAP progress to how teachers clicked through the STEMscopes Math program to ask if more use resulted in more growth. ALI captures digital usage data across its’ product lines. Usage data are available at the teacher level. Data includes the number of clicks total for a teacher across the year, as well as clicks in individual elements of the program, particularly within the 5Es, as well as the intervention and acceleration (I/A) sections.
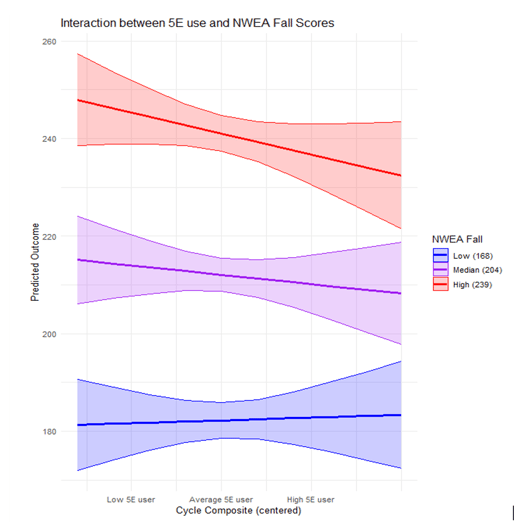
In our statistical model, we looked at how
“every 10 clicks” across the 5Es (versus in a specific component) predicted MAP growth. When we look at the findings this way, we see an interesting pattern. We see what is called a “main effect” of the 5E composite—that is, for every ten 5E clicks there is a 0.48 (so about a half a point) increase in growth. From a statistical standpoint, we would characterize this as a medium effect. Yet, interestingly, there was also an effect called an “interaction”such that not all teacher clicks predicted student scores in the same way. If a student had a low fall MAP score, then higher usage of the 5E model by their teacher predicted greater math gains across the year, or an enhanced effect. In contrast, for students who started at the average or higher in the Fall, the benefit of additional usage tapers or is dampened, see figure below. This may suggest that students with higher Fall achievement need more of the “acceleration” activities that are available in the STEMscopes Math program. Program click data suggested this element was not used often.
For this question, we needed STAAR data from different schools/districts to compare with Pleasanton ISD schools. We got this data through a public information request to the Texas Education Agency (TEA). We used propensity score matching to make sure that the schools we requested data for had a similar student population as Pleasanton's schools. Once we got the data, we were able to compare the individual students (instead of school populations). This comparison showed that we still had some key differences across our groups. Thus, we matched again, this time comparing student to student to make sure we could make a fair comparison. We then used regression analyses to predict STAAR 2025 math scores for students who had STEMscopes Math plus coaching and comparison students who did not, while controlling for student factors and 2024 scores.
STEMscopes Math plus coaching was associated with a positive and significant effect such that students who were taught with STEMscopes Math and whose teachers were coached scored 15.19 points higher, on average, than students in the comparison group. There were also significant differences in students’ achievement of STAAR benchmarks.
Adding coaching to STEMscopes Math had a positive impact on student math achievement. But program usage varies across teachers, and how well a program works also varies across students. How much a teacher used the STEMscopes Math program influenced student math growth. We also saw evidence that prior student achievement also enhanced or dampened program effects. STEMscopes Math plus coaching had an enhanced effect on students who started the 2024-2025 school year with lower math achievement, but there was a dampened effect for students who started with higher achievement. When researchers looked at analytics data, they found few teachers had used the “acceleration supports” designed for high-achieving students and that these may help boost those students’ scores in the future. That said, when STEMscopes Math plus coaching students were compared to students who did not use the program, STEMscopes Math boosted student achievement on the STAAR standardized test and was associated with positive benchmark attainment and movement to higher benchmarks.

Designed to make measurable impacts on student achievement, Accelerate Learning Inc. offers you a customized STEM solution for all your students. Learn how you can preview or demo our products for free.

Explore More Research & Case Studies