Key Findings

Combined Sample, 6th– 8th Grade

  • Schools using Math Nation scored approximately 3 points higher than schools using other math programs on the FAST, and this difference was statistically significant. See Figure 1.
  • Math Nation schools had significantly more students reaching Level 5 proficiency (12.48%) compared to non-Math Nation schools (9.88%). See Figure 2.

Figure 1 - Average Scale Score for 6th -8th grade students at Math Nation schools versus non-Math Nation schoolsFigure 2 - Point difference at each proficiency level for 6th -8th grade students at Math Nation schools versus non-Math Nation schools

Grade Level Comparisons

Sixth Grade

  • Math Nation schools had higher percentages of 6th grade students reaching Level 3 proficiency (24.08%) and Level 5 proficiency (11.52%) than non-Math Nation schools (Level 3: 22.96%, Level 5: 10.96%), although this difference did not reach statistical significance. See Figure 3.
  • Math Nation schools had significantly higher percentages of 6th grade students reaching Level 3 (24.08%) and Level 4 proficiency (24.58%) compared to the 6th grade statewide averages (Level 3: 21.97%, Level 4: 21.80%). See Figure 4.

Figure 3 - Percentage of 6th grade students at each proficiency level in Math Nation versus non-Math Nation schoolsFigure 4 - Point difference in 6th grade students using Math Nation compared to statewide averages

Seventh Grade


  • The main effect of Math Nation on average FAST scale scores and all proficiency rates were significant at the .05 level, apart from Levels 3 and 4. Additionally, effect sizes for all tests ranged from 0.38-0.46. See Table 1.
  • However, the main effect of Math Nation on the percentage of 7th grade students achieving Level 4 proficiency was marginally significant at p = .06.
  • Seventh grade students using Math Nation scored nearly 6 points higher than 7th grade students who did not use Math Nation. See Figure 5.
  • Schools using Math Nation had significantly fewer 7th grade students at the Level 1 (6.11% less) and Level 2 (3.25% less) proficiency levels. See Figure 6.
  • Schools using Math Nation had significantly more 7th grade students achieving higher proficiency levels, with 3.38% more students achieving Level 4, 5.9% more students achieving Level 5, and 9.46% more students achieving Level 3 or above when compared to 7th graders at non-Math Nation schools. See Figure 6.

Figure 5 - Average scale score in 7th grade students in Math Nation schools versus non-Math Nation schoolsFigure 6 - Point difference in 7th grade students in Math Nation versus non-Math Nation schools

Comparison of matched Math Nation and non-Math Nation 7th grade performance

  Math Nation Mean (SD) Non-Math Nation Mean (SD) Mean Difference β p-value Effect size
Average Scale Score 335.16 (12.40) 329.29 (13.22) 5.87 0.06 0.01 0.46
Level 1 18.83% (14.05%) 24.94% (16.21%) -6.11% -0.04 0.03 0.40
Level 2 17.97% (7.77%) 21.22% (9.34%) -3.25% -0.03 0.04 0.38
Level 3 27.41% (8.05%) 27.32% (9.84%) 0.10% -0.01 0.57 0.01
Level 4 20.70% (9.32%) 17.32% (13.32%) 3.38% 0.03 0.06 0.29
Level 5 15.06% (14.58%) 9.16% (11.63%) 5.90% 0.05 0.01 0.45
Level 3 or above 63.22% (20.22%) 53.76% (24.14%) 9.46% 0.06 0.02 0.42

Table 1

Eighth Grade

  • Math Nation schools had slightly higher 8th grade FAST scores (M = 328.24) than non-Math Nation schools (M = 326.80), although this difference did not reach statistical significance.
  • Math Nation schools had lower percentages of 8th grade students at Levels 1 (19.68%) and Level 2 (21.28%) proficiency than 8th grade students at non-Math Nation schools (Level 1: 21.48%, Level 2: 22.52%), although this difference did not reach statistical significance. See Figure 7.
  • Math Nation schools had higher percentages of 8th grade students reaching Level 4 (23.72%), Level 5 (11.52%), and Level 3 or above (59.08%) proficiency when compared to 8th grade students at non-Math Nation schools (Level 4: 21.64%, Level 5: 10.96%, Level 3 or above: 56.04%). However, these differences did not reach statistical significance. See Figure 7.
  • Math Nation schools had significantly more students reaching Level 4 proficiency (18.90%) than the state average (14.70%). See Figure 8.

Figure 7 - Table 1. Comparison of matched Math Nation and non-Math Nation 7th grade performanceFigure 8 - Point difference in proficiency rates for 8th grade students at Math Nation schools versus statewide averages

Conclusions

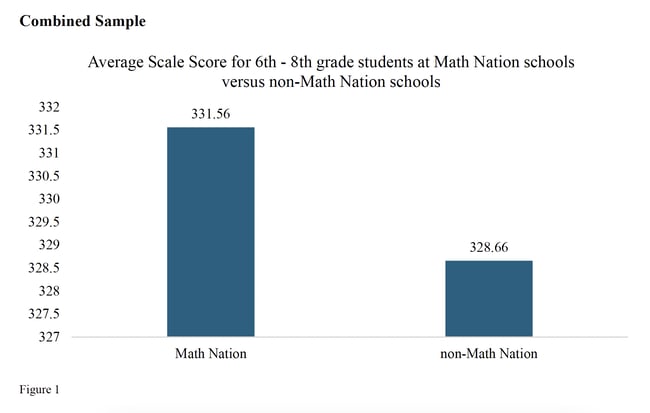
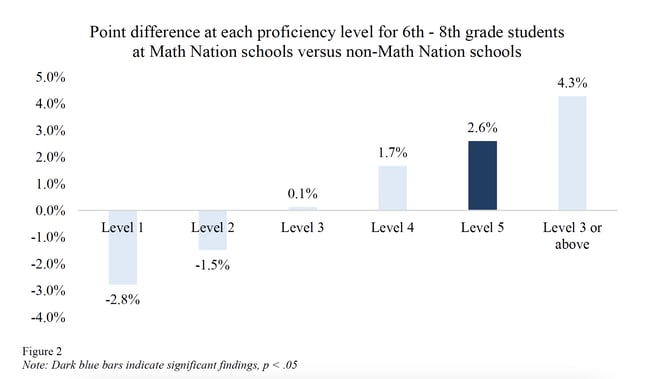
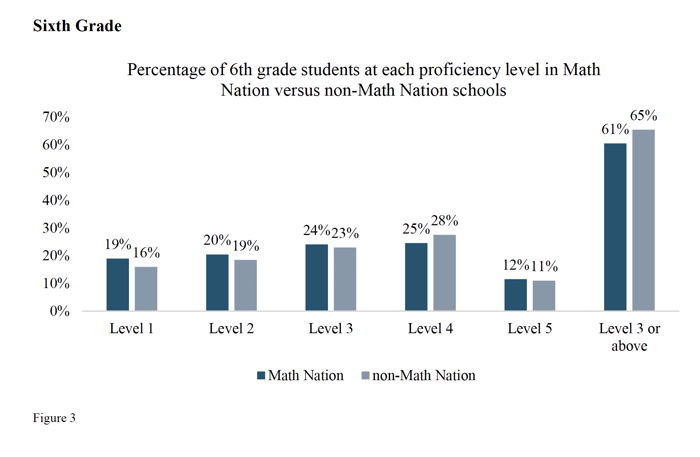
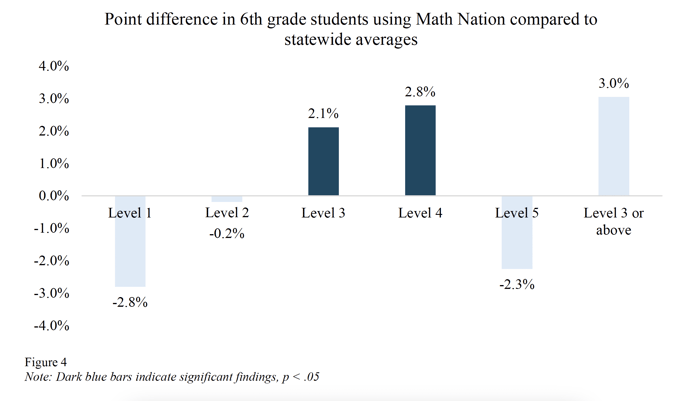
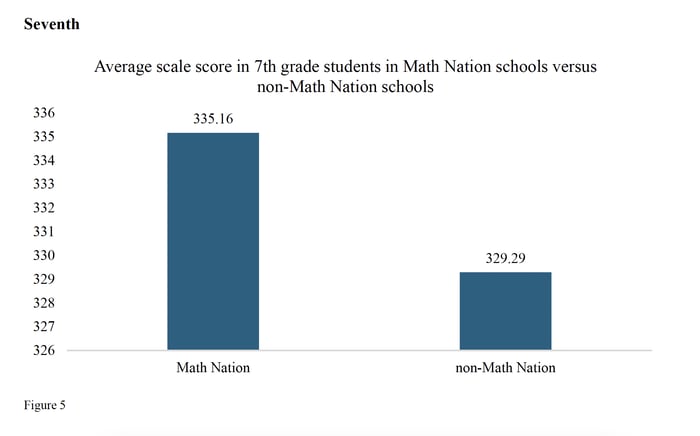
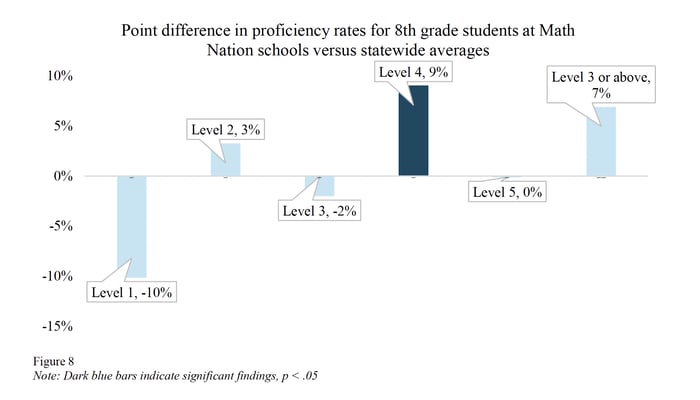
This report provides evidence that schools that used Math Nation in the 2022-2023 school year had higher math achievement in 6th-8th grade. Schools that used Math Nation had significantly higher scores and significantly higher percentages of students achieving Level 5 proficiency. Specifically, Math Nation schools scored 2.90 points higher and had 2.60% more students who achieved Level 5 proficiency. Differences were also seen between each grade level. In 6th grade, schools using Math Nation had 2.11% more students scoring at the Level 3 proficiency level, and 2.78% more students scoring at the Level 4 proficiency level compared to the statewide average. The effects of Math Nation were particularly robust for 7th grade students. Specifically, schools that used Math Nation in 7th grade had a significant 6-point increase in scores, had significantly fewer students at Levels 1 and 2, and nearly 6% more students achieving Level 5 proficiency. Moreover, almost 10% more 7th grade students achieved Level 3 or higher when using Math Nation compared to their non-Math Nation peers. Effect sizes were medium to large based on field standards. Lastly, 8th grade students using Math Nation had 4% more students achieving Level 4 proficiency when compared to the statewide average, representing a significant increase. Taken together, these findings provide consistent support for the effectiveness of Math Nation.